Asset Intelligence

Telemetry Analysis

Your assets are already telling you they are about to fail. The signal is spread across temperature, load, vibration and a dozen other channels, and nobody reads it. Ascendo learns what normal looks like for each individual unit, finds the correlated signals that actually drive failures, and scores the risk before the failure surfaces.

  • Learns normal and abnormal behaviour per serial number
  • Correlated signals across channels, not isolated spikes
  • Risk and confidence scoring rather than another binary alarm
  • Evaluate a single asset or a whole fleet on demand

Watch the full tour

Verify your work email once and every research paper, case study and product tour on ascendo.ai opens, right here, without leaving the page.

  • Takes about 30 seconds
  • Work email only, no spam

Reacting late, on a hunch

Reliability teams react after the issue, with limited visibility into the patterns building underneath, which leads to expensive escalations and decisions made on instinct.

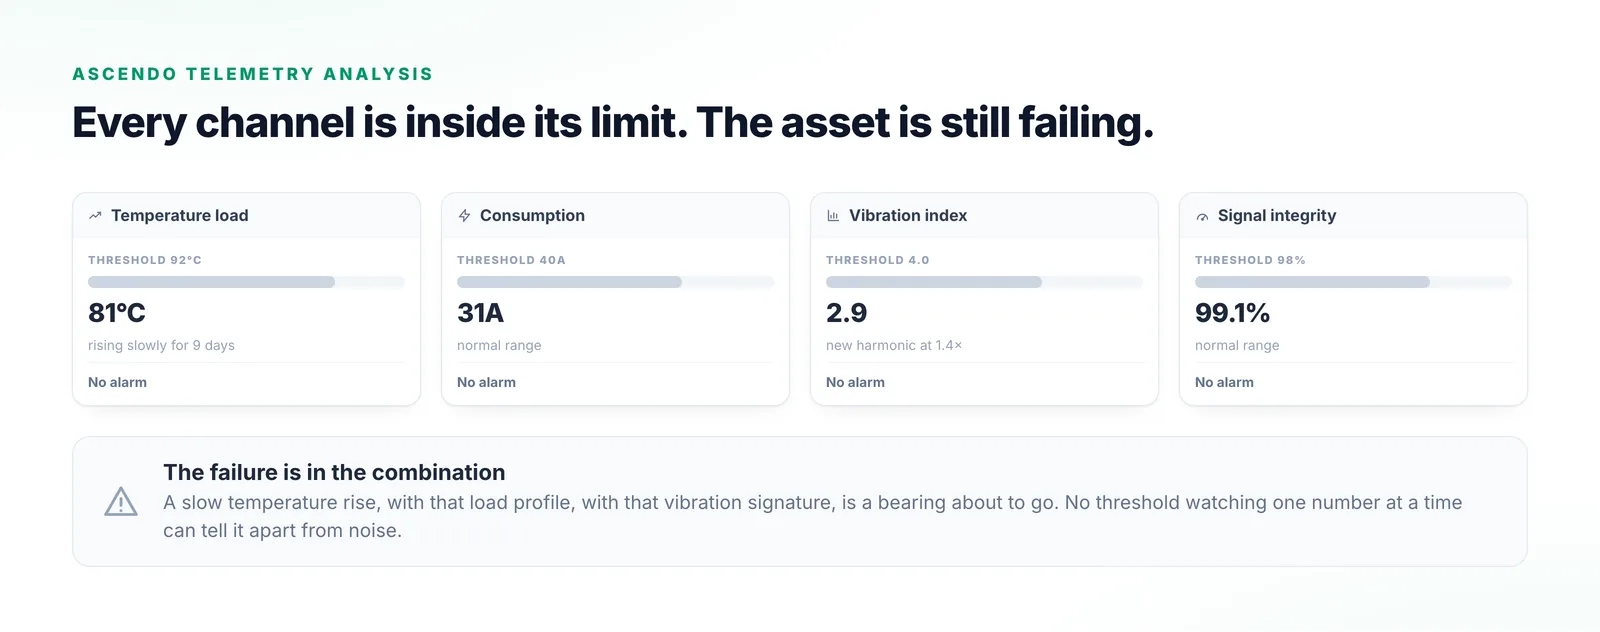
Failure signals are correlated across channels rather than visible in any single one. A temperature rise alone is noise; the same rise with a particular load pattern and a vibration signature is a bearing about to go. So the alarms that fire are frequently the wrong ones, and the team learns to discount them.

Four telemetry channel cards — temperature load, consumption, vibration index and signal integrity — each showing a reading below its configured threshold and a verdict of no alarm.
Four channels, four readings inside their limits, nothing raised — and a bearing failure already underway in the combination.

From raw channels to a scored risk

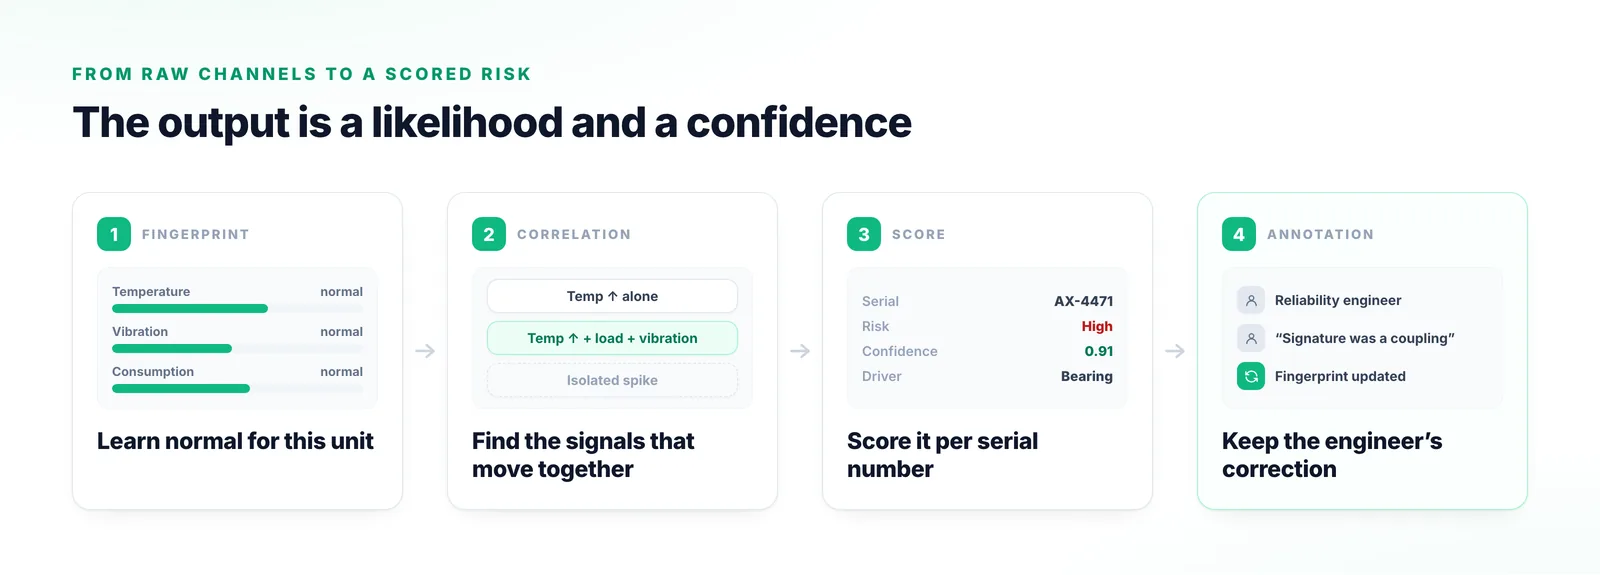
The output is not an alarm. It is how likely something is, and how sure the system is about it.

  1. Step 1

    Build the fingerprint

    Multi-dimensional time series telemetry builds an intelligent asset fingerprint, a continuously learned picture of what normal and abnormal look like for that asset specifically.

  2. Step 2

    Find the correlations

    A deep learning model looks for the correlated signals that actually drive anomalies, rather than for an isolated spike on any one channel.

  3. Step 3

    Score per serial number

    Analysis runs per serial number, predicting issues before they surface, with a confidence attached rather than a bare verdict.

  4. Step 4

    Take the correction

    Engineers annotate what the system got right and wrong, and those corrections persist, so the model tunes to your fleet.

Four-stage pipeline running from learning an asset’s normal behaviour, through finding the signals that move together, to a risk and confidence score per serial number and an engineer’s annotation feeding back.
The loop closes where most predictive maintenance stops: an engineer’s correction going back into the fingerprint.

What separates this from the alarms you already have

The competitor here is not another vendor. It is the alert fatigue your team already lives with.

Correlated signals, not isolated spikes

A single channel crossing a line says very little. The pattern across channels is what precedes the failure, and it is invisible to any alarm watching one number at a time.

“The system continuously learns normal and abnormal behavior, identifying correlated signals that actually drive anomalies, not just isolated spikes.”
From the tour

Noise is treated as the problem to beat

Any system that adds to the alert pile has failed, however accurate it is. Filtering across alert signals is part of the job here rather than a setting somebody tunes afterwards.

“Our agents can also go through the noise across alert signals and filter what is important.”
From the tour

Your engineers correct it, and it keeps the correction

It will not understand your equipment at first. Annotations let a reliability engineer say what a signature really meant, and that correction persists.

“identifying true correlations, providing risk and confidence scoring, and enabling a human feedback loop through annotations, so the system continuously improves”
From the tour
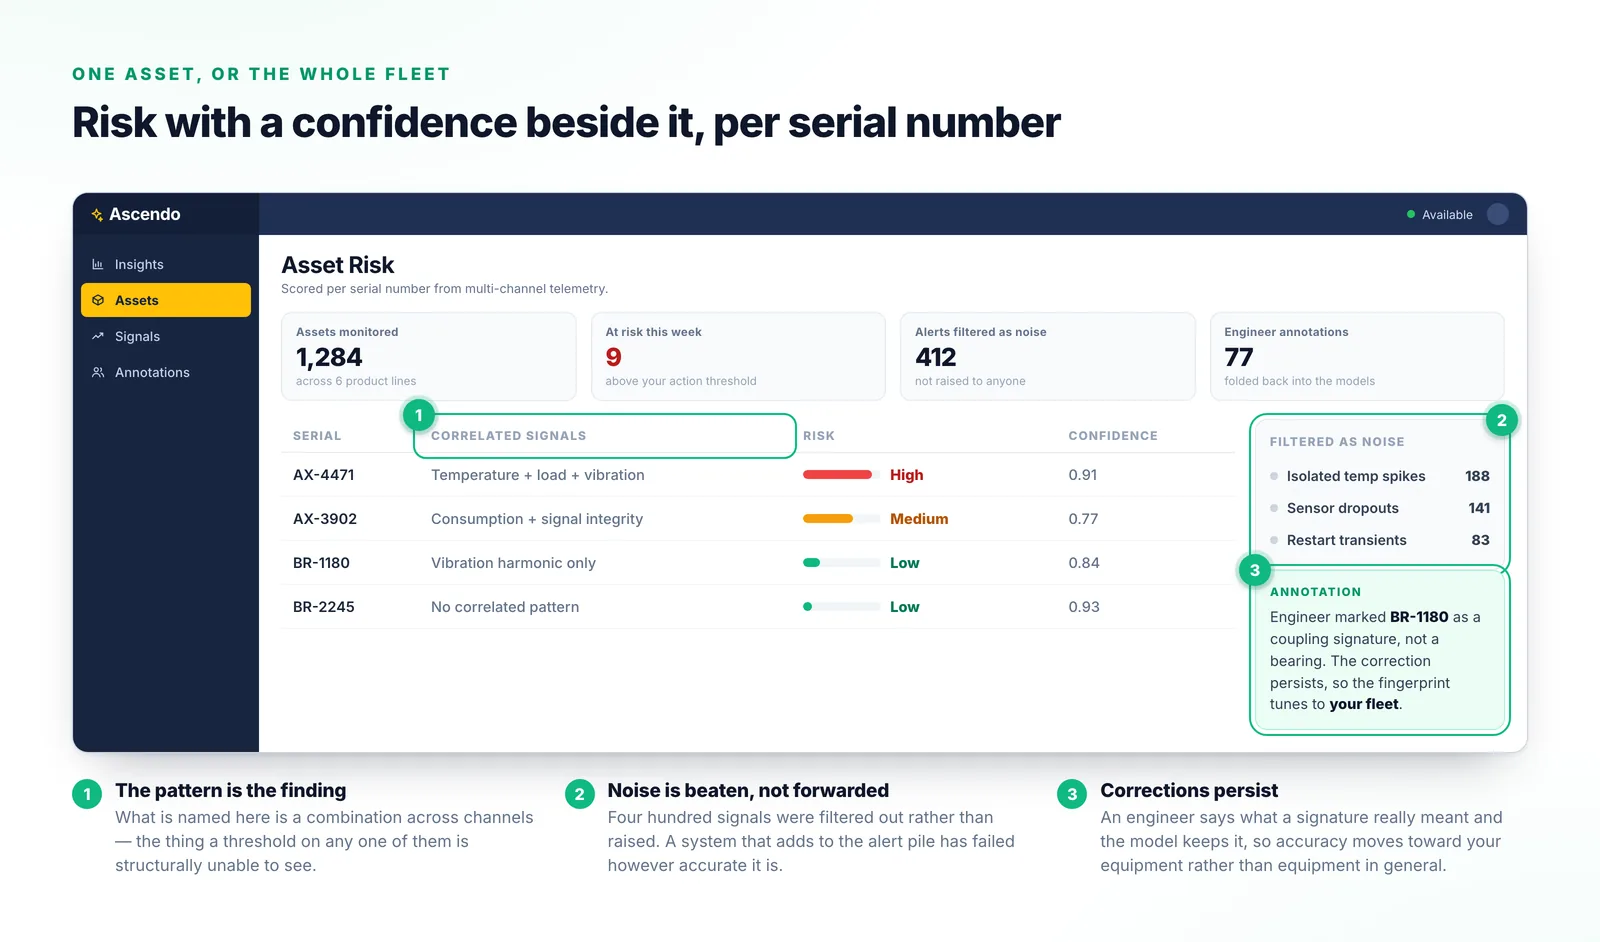
An Asset Risk screen listing four serial numbers with the correlated signals behind each, a risk meter and confidence value, alongside a panel of alerts filtered as noise and a stored engineer annotation.
Risk never appears without a confidence beside it, and 412 signals were filtered out rather than paged to anybody.

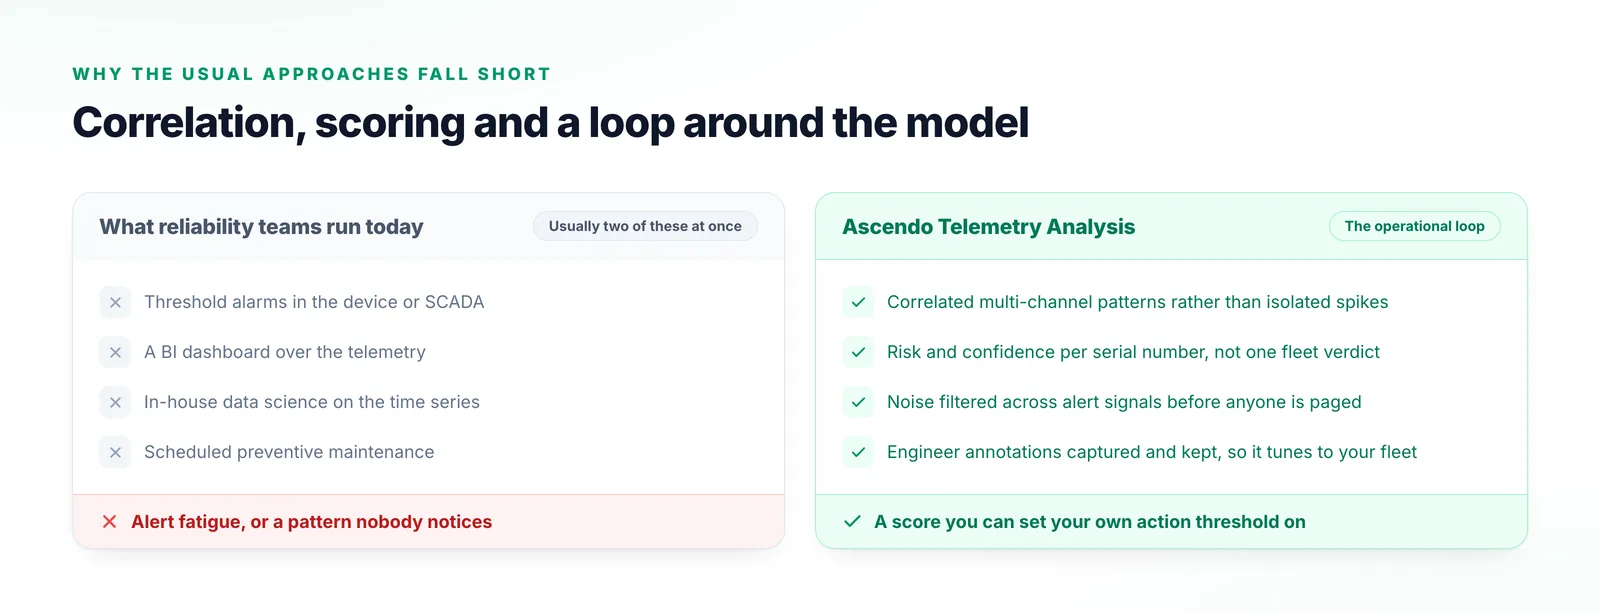
Why the usual approaches fall short

Most reliability teams are running at least two of these today.

Threshold alarms in the device or SCADA

Fire on isolated spikes, blind to correlated patterns, and they produce the alert fatigue that has to be beaten.

A BI dashboard over the telemetry

Shows the history accurately and waits for a human to notice a pattern in it. Noticing is the step that does not happen.

In-house data science on the time series

A good team can build the model. The gap is the operational loop around it: scoring per unit, filtering noise, capturing annotations.

Scheduled preventive maintenance

Services healthy assets on a calendar and still misses the one that fails early.

Two columns setting the monitoring approaches reliability teams already run against what Ascendo’s telemetry analysis does differently.
A capable data science team can build the model. What takes longer is everything in the right-hand column around it.

What things are called

The vocabulary used in the recording.

Intelligent asset fingerprint
The learned picture of normal and abnormal behaviour for a specific asset, built from multi-dimensional telemetry.
Correlated signals
Multi-channel patterns that drive an anomaly, as opposed to an isolated spike on one channel.
Monitored signals
The channels assessed over time — temperature load, consumption, vibration index and signal integrity among them.
Risk and confidence scoring
The output: how likely the issue is, and how sure the system is about it.
Annotation
A human correction fed back into the system so the model improves on your equipment.
Serial number
The unit of analysis. Predictions are made per asset rather than per product line.

Frequently Asked Questions

We do not publish a lead time, and any figure we quoted would be about somebody else’s equipment. The useful answer is a backtest: run it against your own historical failures and see how early the risk score moved on assets where you already know the ending.

Asset Intelligence

Backtest it on failures you already know about

Lead-time claims are easy to make and hard to trust. Give us telemetry from assets that have already failed and we will show you when the risk score would have moved.

Talk to us